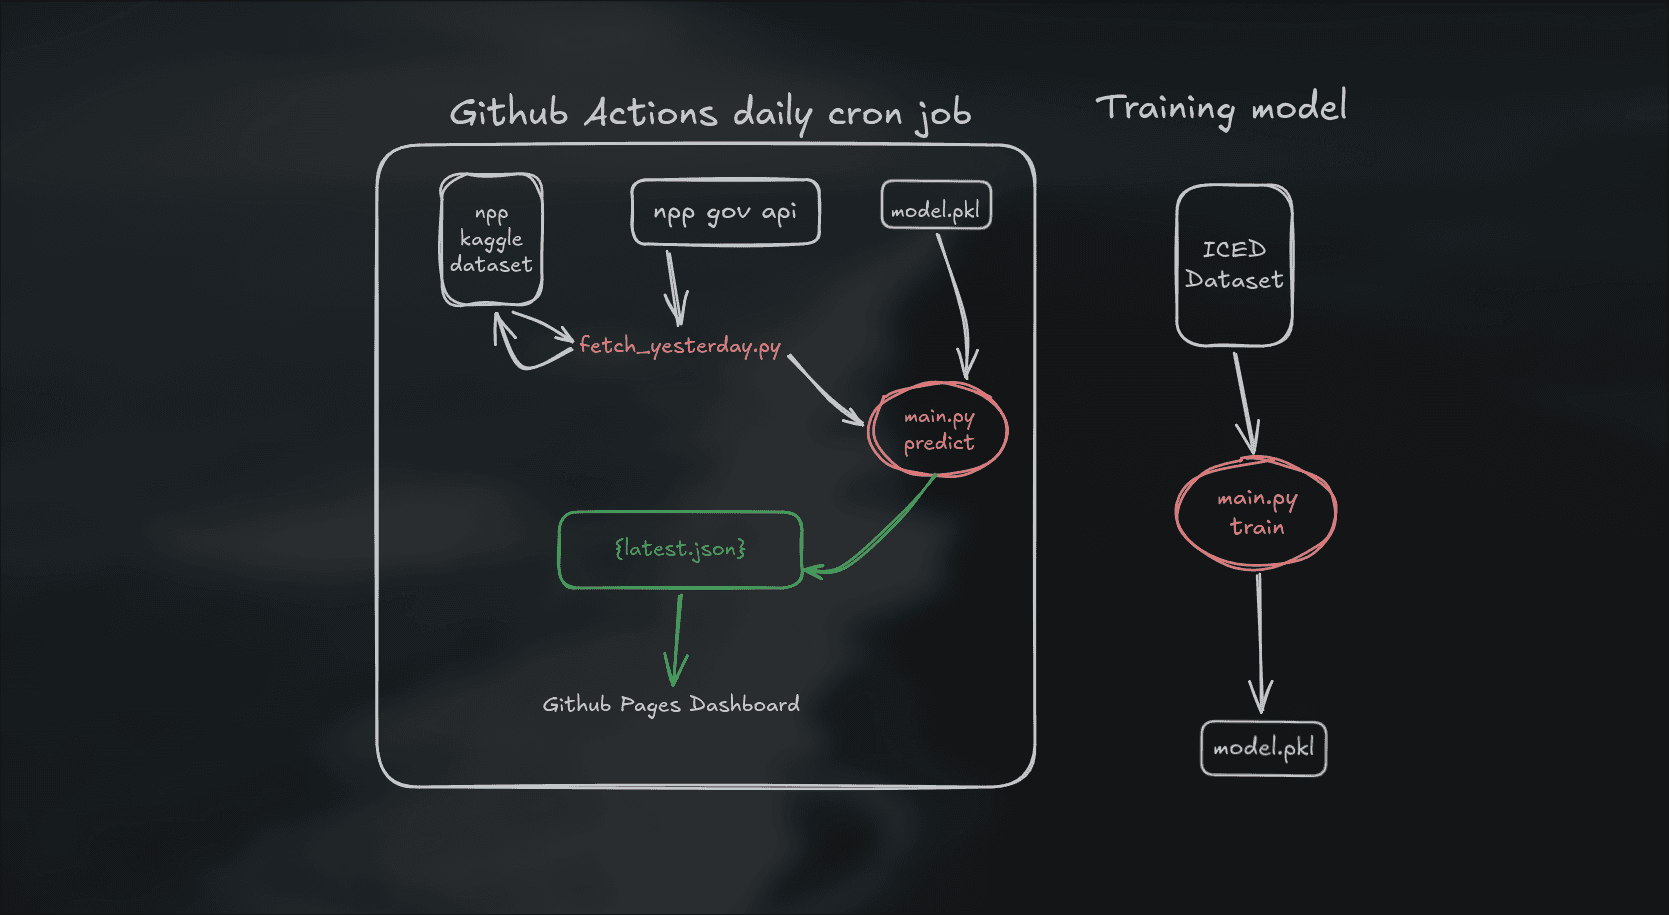
Built a daily updating public dataset of India’s electricity demand by continuously pulling from an open government source, currently exceeding 100,000 rows.
Set up a GitHub Actions pipeline that handles data extraction, processing, Kaggle synchronization, and deployment with no manual intervention.
Deployed a live static web dashboard on GitHub Pages showing a rolling 48-hour forecast, refreshed daily by the automated pipeline.
The api is unprocted and dumps json directly on curl 'https://npp.gov.in/dashBoard/demandmet1chartdata?date=2026-06-08'
The Endpoints served data all the way from sep25, my scripts/fetch_yesterday script runs everyday and updates the dataset with latest rows.
ICED dataset is longer and scripts/clean_datasets.py cleans and src/data_pipeline.py merges them to get
Combined time series spans from 2017-01-01 00:00:00 to present.
Currently, using merged data for training and NPP dataset for inference.
TODO: By trial and error in google-colab, improve the training methods and accuracy.